Blockchain
.com
Home
Prices
Charts
NFTs
Buy
More
Home
Prices
Charts
NFTs
DeFi
Academy
News
Developers
Wallet
Exchange
Bitcoin
Ethereum
Bitcoin Cash
Blockchain
.com
Sign In
Sign In
Blockchain Charts
The most trusted source for data on the bitcoin blockchain
Currency Statistics
Block Details
Mining Information
Network Activity
Market Signals
Popular Stats
Market Price (USD)
$62,940
USD
The average USD market price across major bitcoin exchanges.
Average Block Size (MB)
1.58
MB
The average block size over the past 24 hours in megabytes.
Confirmed Transactions Per Day
467,756
Transactions
The total number of confirmed transactions per day.
Mempool Size (Bytes)
124,799,549
Bytes
The aggregate size in bytes of transactions waiting to be confirmed.
Currency Statistics
Total Circulating Bitcoin
The total number of mined bitcoin that are currently circulating on the network.
Market Price (USD)
The average USD market price across major bitcoin exchanges.
Market Capitalization (USD)
The total USD value of bitcoin in circulation.
Exchange Trade Volume (USD)
The total USD value of trading volume on major bitcoin exchanges.
Bitcoin Cycle Indicators
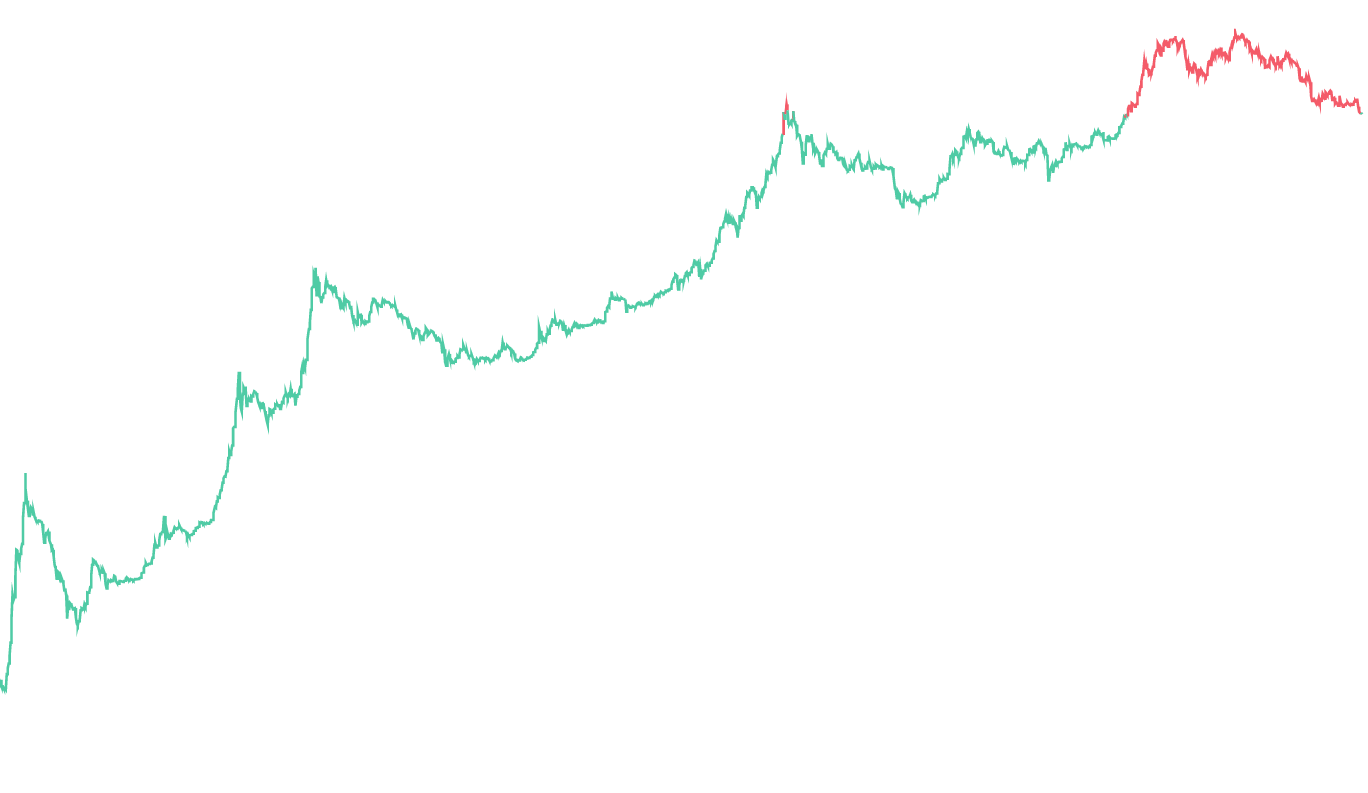
Bitcoin Profitable Days
Number of days in which holding bitcoin has been profitable, relative to current price.
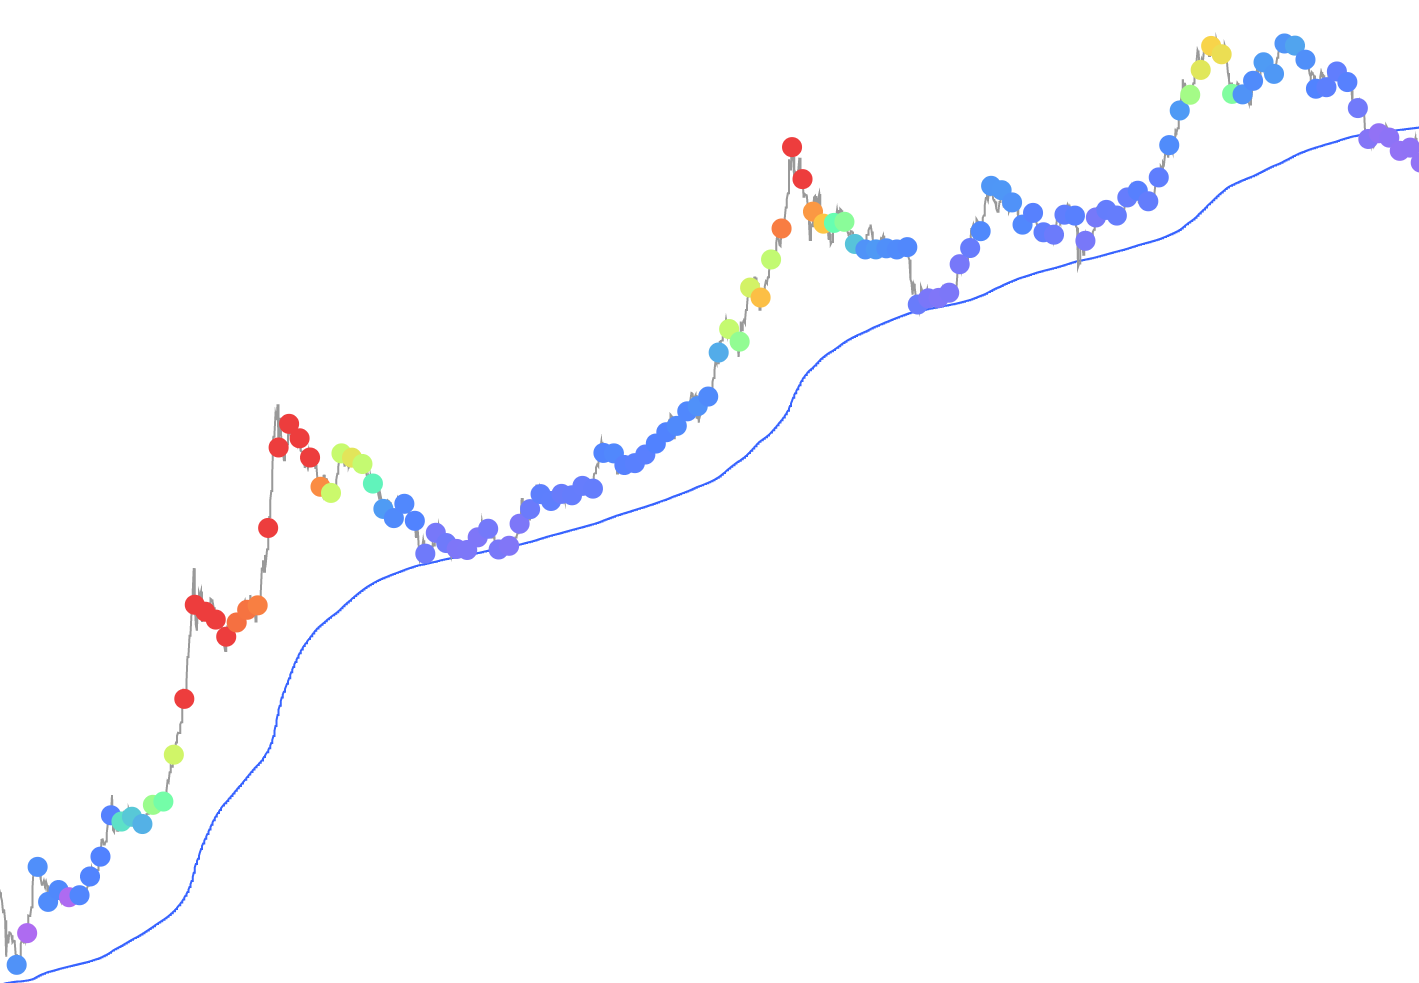
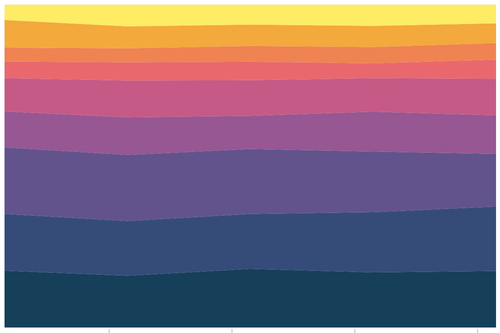
200 Week Moving Average Heatmap
Monthly heatmap on the percent change of the 200 week moving average
Block Details
Blockchain Size (MB)
The total size of the blockchain minus database indexes in megabytes.
Average Block Size (MB)
The average block size over the past 24 hours in megabytes.
Average Transactions Per Block
The average number of transactions per block over the past 24 hours.
Average Payments Per Block
The average number of payments per block over the past 24 hours.
Total Number of Transactions
The total number of transactions on the blockchain.
Median Confirmation Time
The median time for a transaction with miner fees to be included in a mined block and added to the public ledger.
Average Confirmation Time
The average time for a transaction with miner fees to be included in a mined block and added to the public ledger.
Mining Information
Total Hash Rate (TH/s)
The estimated number of terahashes per second the bitcoin network is performing in the last 24 hours.
Hashrate Distribution
An estimation of hashrate distribution amongst the largest mining pools.
Hashrate Distribution Over Time
An estimation of hashrate distribution over time amongst the largest mining pools
Network Difficulty
A relative measure of how difficult it is to mine a new block for the blockchain.
Miners Revenue (USD)
Total value in USD of coinbase block rewards and transaction fees paid to miners.
Total Transaction Fees (BTC)
The total BTC value of all transaction fees paid to miners. This does not include coinbase block rewards.
Total Transaction Fees (USD)
The total USD value of all transaction fees paid to miners. This does not include coinbase block rewards.
Fees Per Transaction (USD)
Average transaction fees in USD per transaction.
Cost % of Transaction Volume
A chart showing miners revenue as percentage of the transaction volume.
Cost Per Transaction
A chart showing miners revenue divided by the number of transactions.
Network Activity
Unique Addresses Used
The total number of unique addresses used on the blockchain.
Confirmed Transactions Per Day
The total number of confirmed transactions per day.
Confirmed Payments Per Day
The total number of confirmed payments per day.
Transaction Rate Per Second
The number of transactions added to the mempool per second.
Output Value Per Day
The total value of all transaction outputs per day. This includes coins returned to the sender as change.
Mempool Transaction Count
The total number of unconfirmed transactions in the mempool.
Mempool Size Growth
The rate at which the mempool is growing in bytes per second.
Mempool Size (Bytes)
The aggregate size in bytes of transactions waiting to be confirmed.
Mempool Bytes Per Fee Level
The current state of the mempool organized by bytes per fee level.
Unspent Transaction Outputs
The total number of valid unspent transaction outputs. This excludes invalid UTXOs with opcode OP_RETURN
Transactions Excluding Popular Addresses
The total number of transactions excluding those involving the network's 100 most popular addresses.
Estimated Transaction Value (BTC)
The total estimated value in BTC of transactions on the blockchain. This does not include coins returned as change.
Estimated Transaction Value (USD)
The total estimated value in USD of transactions on the blockchain. This does not include coins returned as change.
Market Signals
Market Value to Realised Value
MVRV is calculated by dividing Market Value by Realised Value. In Realised Value, BTC prices are taken at the time they last moved, instead of the current price like in Market Value
Network Value to Transactions
NVT is computed by dividing the Network Value (= Market Value) by the total transactions volume in USD over the past 24hour.
Network Value to Transactions Signal
NVTS is a more stable measure of NVT, with the denominator being the moving average over the last 90 days of NVT's denominator
Explore top crypto assets.
/